
Reno, NV Market Update – February 2025
The median listing sales price in Reno reached $615K, reflecting a 10.0% year-over-year increase. Homes are spending an average of 103 days on the market, 10 days longer than last year. A total of 250 homes were sold, marking a 4.0% annual increase.
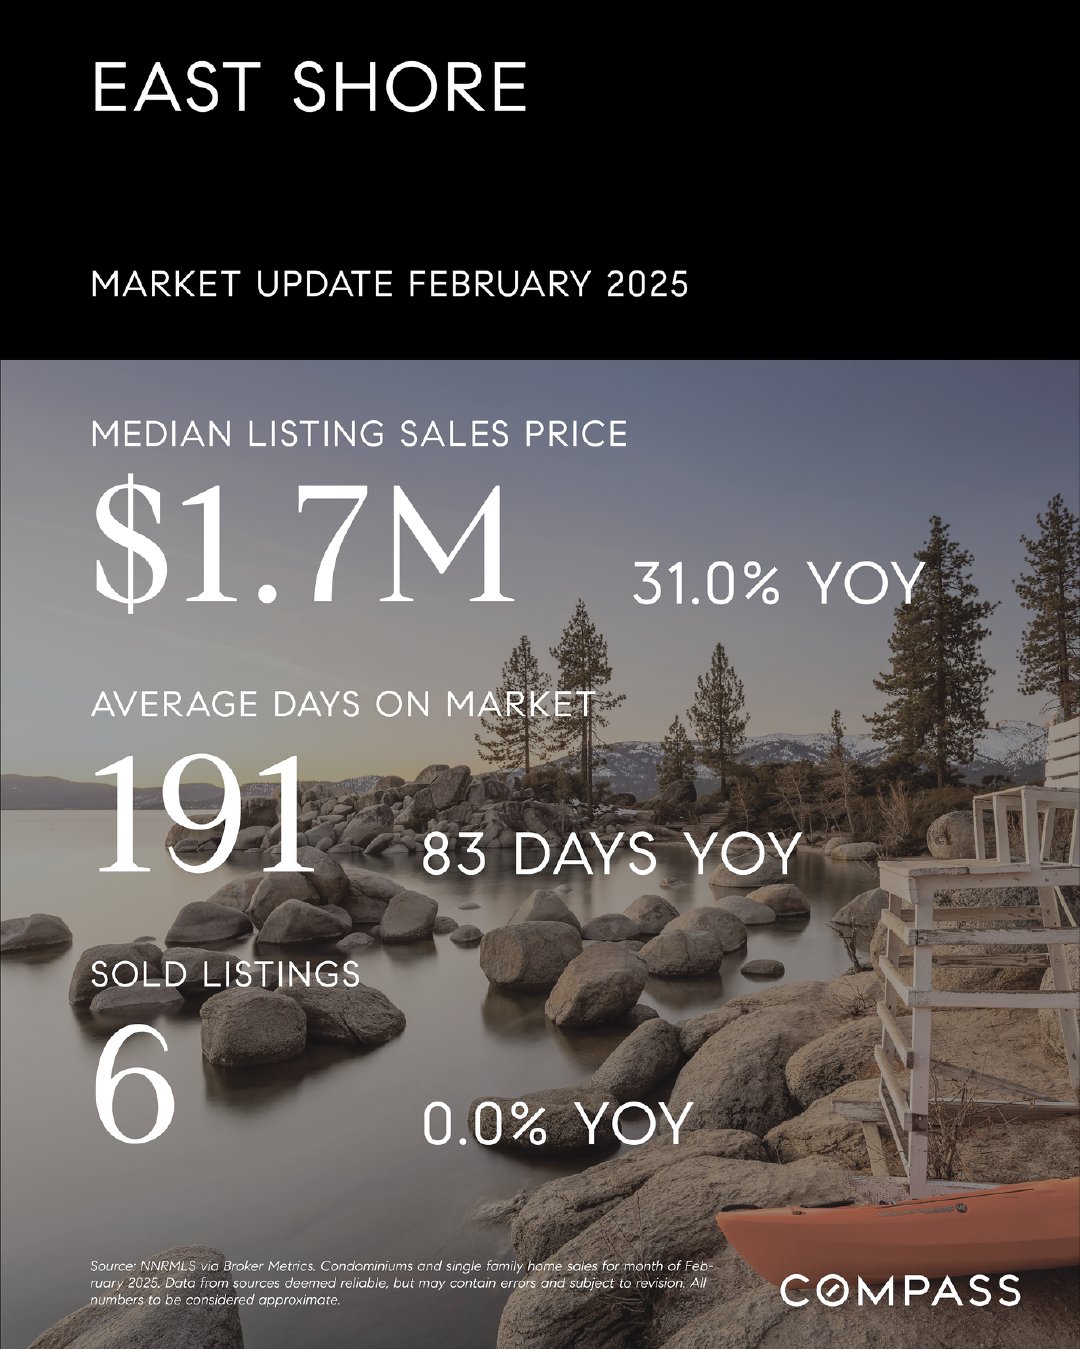
East Shore Market Update – February 2025
The median listing sales price in East Shore rose to $1.7M, reflecting a 31.0% year-over-year increase. Homes are spending an average of 191 days on the market, 83 days longer than last year. A total of 6 properties were sold, showing no change from the previous year.
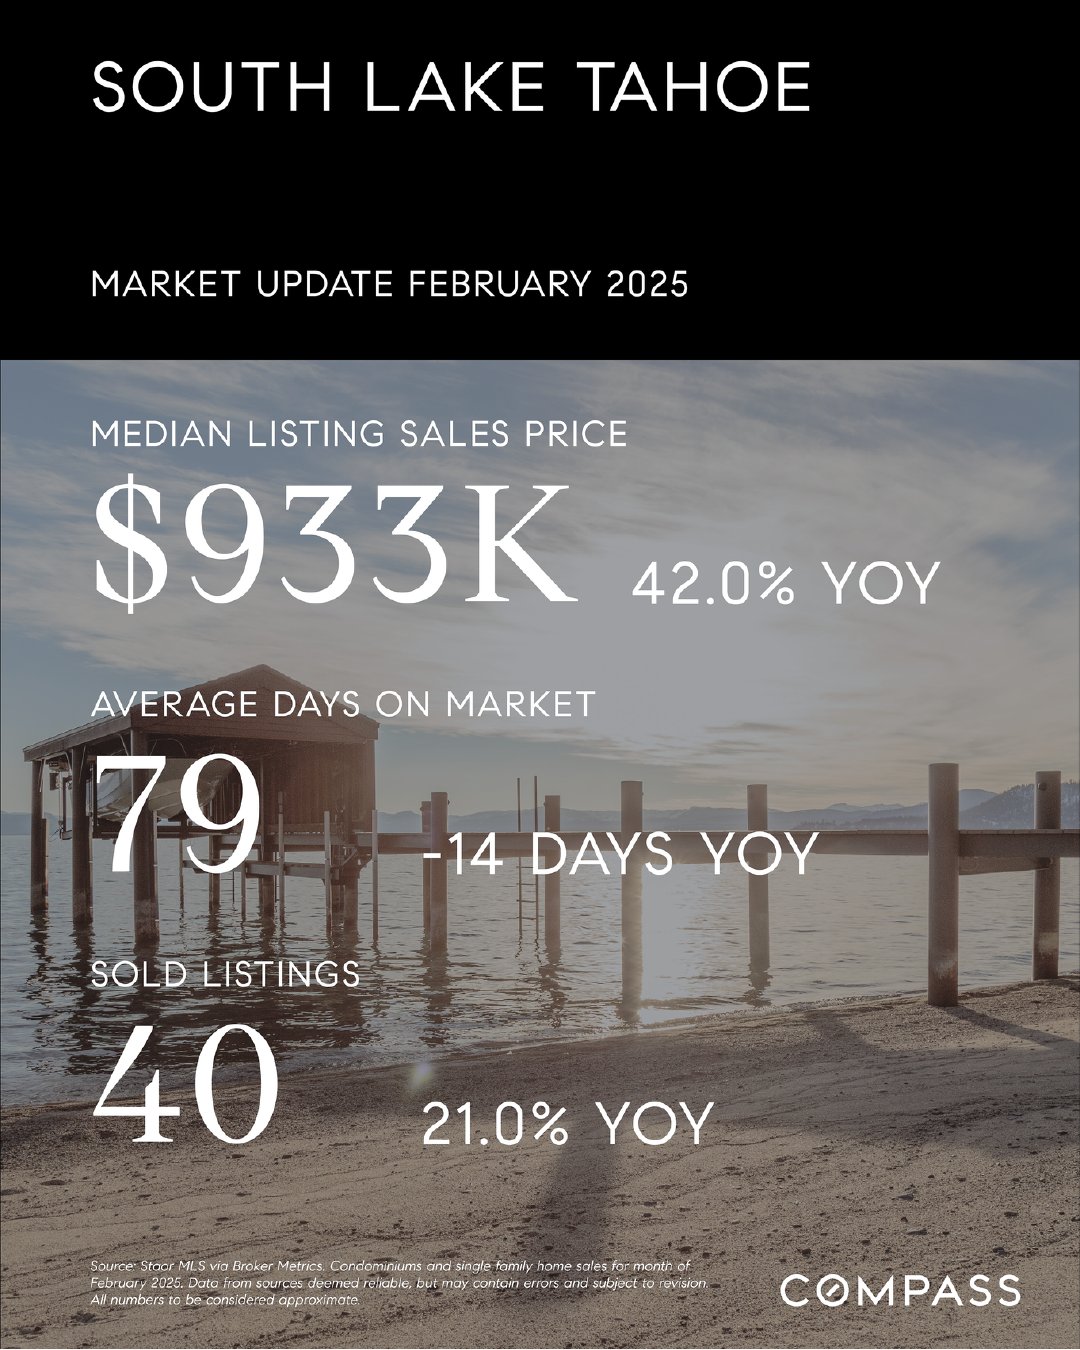
South Lake Tahoe Market Update – February 2025
The median listing sales price in South Lake Tahoe climbed to $933K, reflecting a 42.0% year-over-year increase. Homes are selling faster, with an average of 79 days on the market, 14 days fewer than last year. A total of 40 properties were sold, marking a 21.0% annual increase.
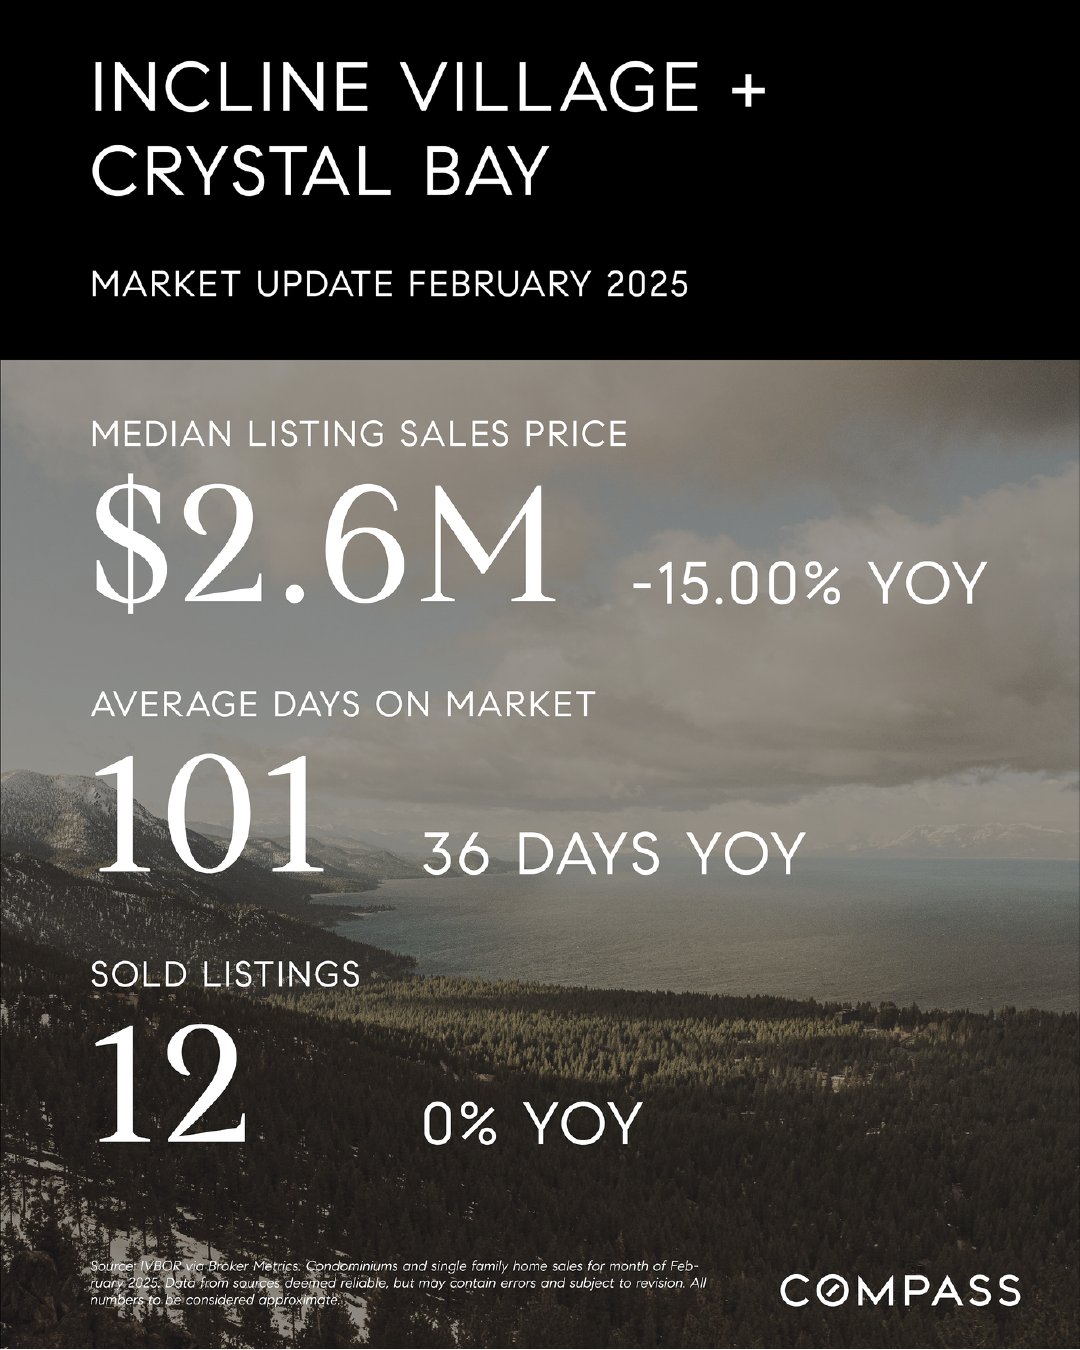
Incline Village & Crystal Bay Market Update – February 2025
The median listing sales price in Incline Village and Crystal Bay dropped to $2.6M, a 15.0% decrease year-over-year. Homes are spending an average of 101 days on the market, 36 days longer than last year. A total of 12 properties were sold, showing no change from the previous year.
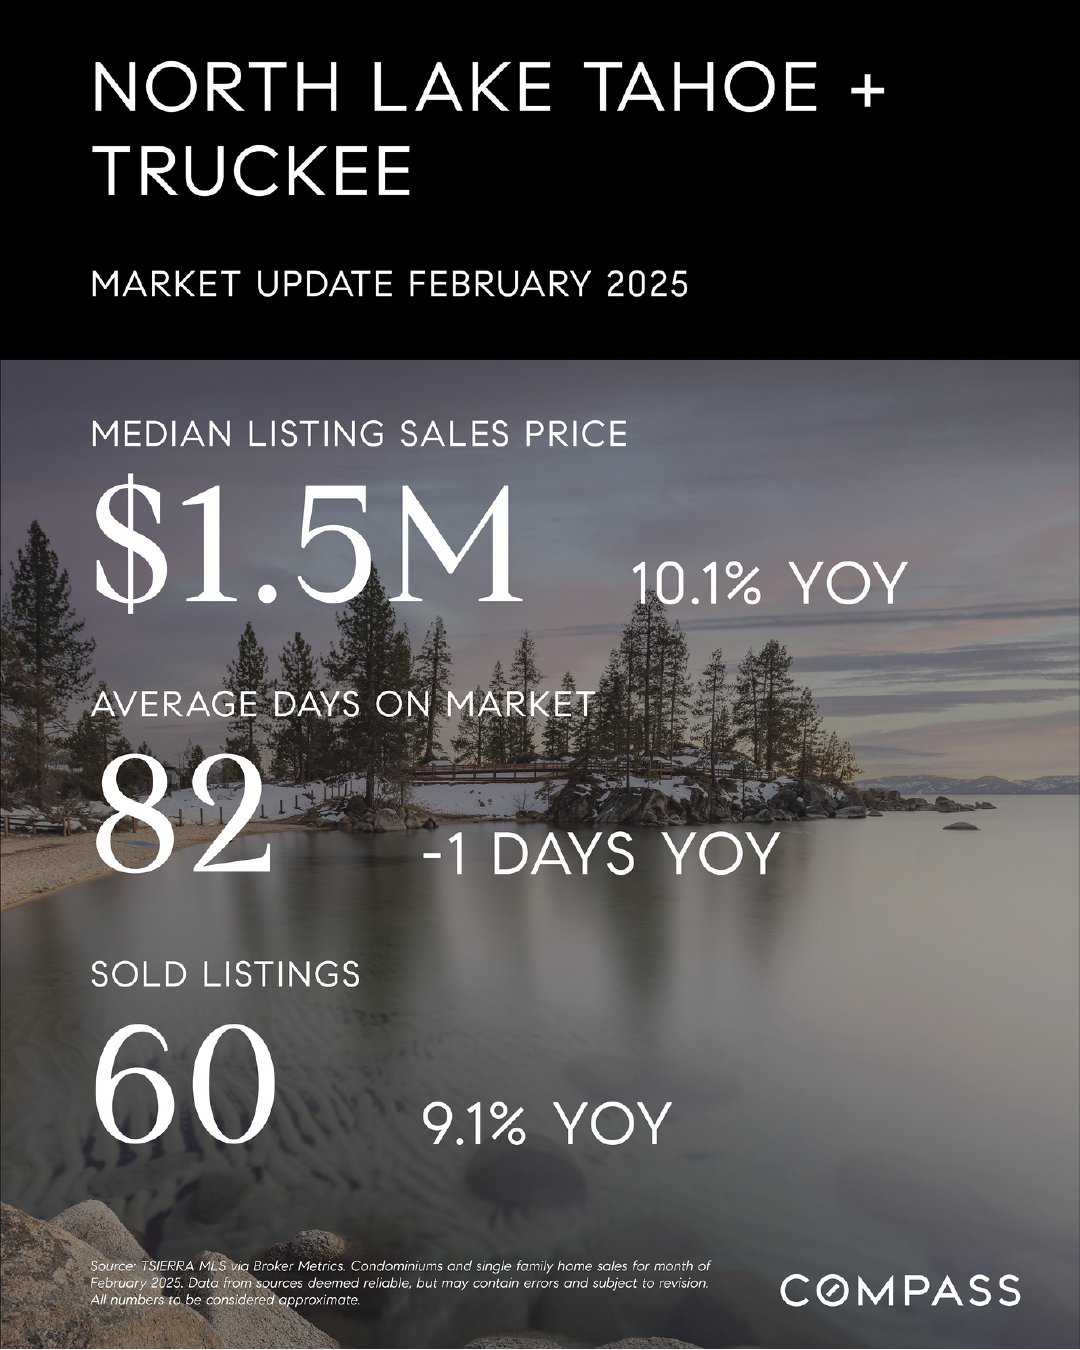
North Lake Tahoe & Truckee Market Update – February 2025
The median listing sales price in North Lake Tahoe and Truckee declined to $1.5M, a 10.1% decrease year-over-year. Homes are selling in an average of 82 days on the market, one day faster than last year. A total of 60 properties were sold, marking a 9.1% annual increase.
READ THE REPORTS:


|
|
|
|
The monthly median house sales price began its usual rebound from the mid-winter low and also increased year over year. It will typically continue to rise through June as the spring market heats up.
|
|
|
|
The median condo/co-op sales price also increased on both a month-over-month and year-over-year basis.
|
|
|
|
The quantity of new listings coming on market usually rises quickly to peak in mid-late spring. The number in February ticked up 4% year over year.
|
|
|
|
The supply of active listings in February 2025 was the highest month-of-February count in 6 years, but still significantly below pre-pandemic norms. Active listings can be expected to rise month by month into autumn.
|
|
|
|
On an annual basis, the number of existing-home sales in 2024 hit its lowest point in 30 years. This monthly chart depicts the effects of the pandemic boom and then soaring interest rates in 2022, while also illustrating how market seasonality plays out within the calendar year. February 2025 sales rose from January, but declined from February 2024.
|
|
|
|
Months supply of inventory is a comparison of supply vs. demand, measuring how long it would take to sell the inventory of active listings at the existing rate of sale. On a long-term, pre-pandemic basis, the MSI in February 2025 would not be considered high, but it was the highest February reading since 2019.
|
|
|
|
Since the early-year market is dominated by new listings, February is not normally a month with a high number of price reductions, however last month did have the highest count for the month of February in 6 years.
|
|
|
|
Mortgage interest rates remained significantly down from mid-January
when they rose above 7%. Every tick down improves affordability.
|
|
|
|
It's been a rocky, volatile time in stock markets as investors try to get a handle on the political and economic uncertainty prevailing nationally and internationally. After a huge plunge, markets started to rebound, but it's beyond us to predict what may happen next.
|
|
|
|
After 4 months of increases, inflation declined slightly in the latest reading, but concerns remain regarding the future direction of this major economic indicator.
|
|
|
|
Population change is a big factor in housing markets. This new U.S. Census map illustrates % population changes by county: In the latest 12-month estimates, populations generally rose in metro areas, while dropping in many rural counties.
|
|
|
|
The next 2 charts delineate national changes in 1) the last 12-month period measured by the Census, and 2) since the pandemic hit. Immigration into the country has accounted for the great majority of recent increases in U.S. population.
|
|
|
|
And these charts break out net domestic migration - people moving between regions within the country - and net foreign migration among 4 broad national regions. In domestic migration, only the south saw a net inflow, while all 4 saw substantial gains due to immigration from abroad.
|
|
|
|
With the appreciation of home prices since 2012, and especially since 2020, homeowner equity now constitutes an enormous part of household wealth (for homeowners): Almost $35 trillion.
|
|
|
|
|
|
|
Click Here to View the extended flipbook version